


LPMDT Trading
Custom Range Volume Profile
Custom Range Volume Profile
Couldn't load pickup availability
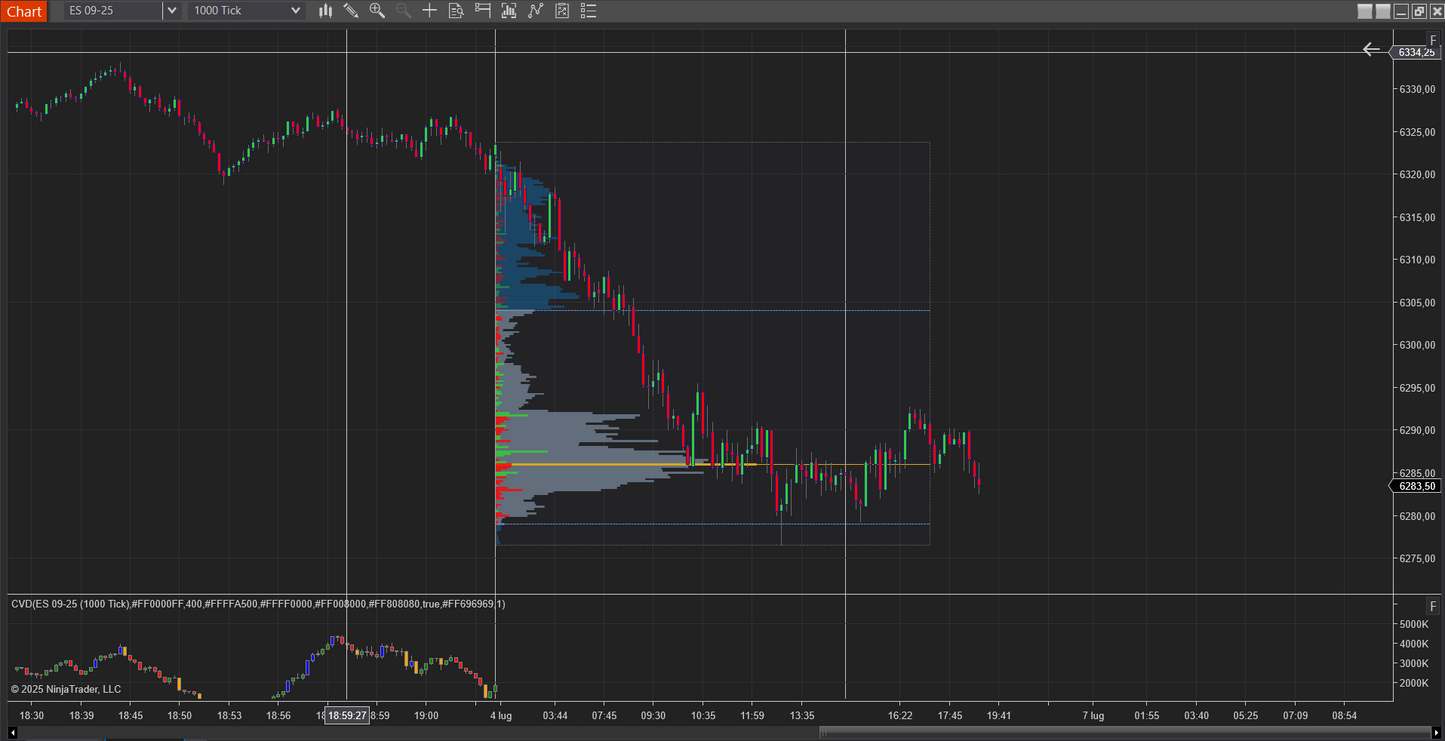
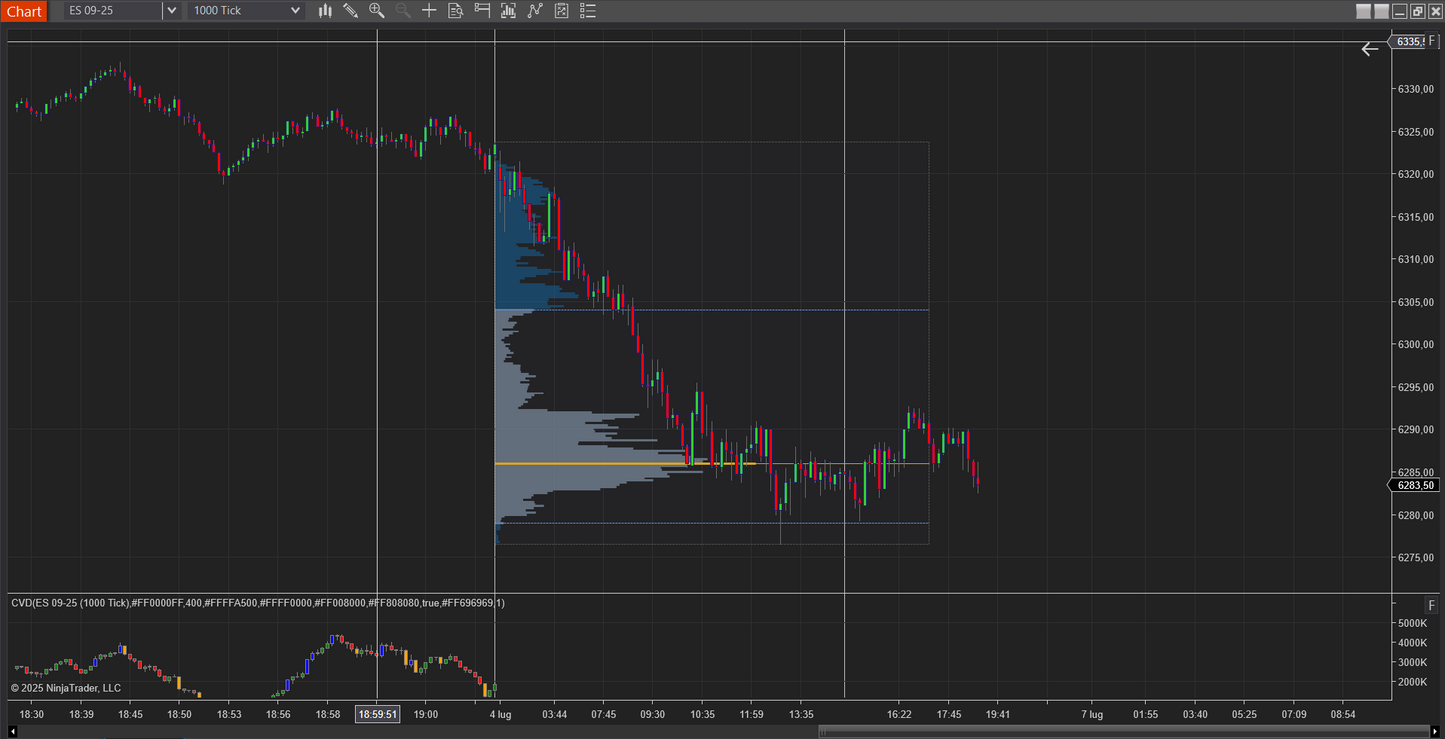
The Custom Range Volume Profile Drawing Tool lets you define any start/end anchors on your chart and instantly plots a horizontal volume histogram over that range. It also offers an optional Delta Profile mode, showing net buy vs. sell volume at each price level.
Key Features
-
Flexible Range Selection
Draw dynamic start and end anchors with your mouse to recalibrate the profile on the fly. -
Total Volume Profile
Displays traded volume at each price as a horizontal bar chart beside the price axis. -
Delta Profile Mode
Instead of total volume, paints net volume (buys minus sells) per price level using separate up/down colors. -
Value Area & POC
Automatically computes and draws: - Value Area High/Low (VAH/VAL) : the upper/lower bounds containing a configurable percentage (default 70%) of total volume.
- Point of Control (POC) : the single price level with the highest volume.
-
Customizable Styling
Choose fill colors, opacities, bar widths, and line strokes for Volume, Delta, Value Area, and POC.ù
A Volume Profile visualizes where market participants traded most heavily, plotting cumulative volume at each discrete price level rather than over time. Key components include:
- Histogram Bars : Longer bars mark price levels with more volume.
- Value Area : The price band encompassing the majority (eg, 70%) of volume—seen as the market's fair-value range.
- POC : The price with the single largest volume—often acting as a magnet or pivot.
- High/Low Volume Nodes : Peaks and valleys in the histogram that can form support/resistance zones or trigger fast moves.
Common Uses
-
Support & Resistance Identification
High-volume nodes tend to hold price, while low-volume areas allow swift breakouts. -
Trend Confirmation
A breakout above a high-volume area on strong volume suggests genuine conviction. -
Entry & Exit Timing
Fade moves at the edges of the Value Area, or target extensions beyond the profile's boundaries. -
Delta Insights
In Delta Profile mode, spots where aggressive buying or selling dominates at specific price levels. -
Contextual Analysis
Combine with price action, order-flow footprints, or moving averages to validate trade setups.
Use this tool to gain a deeper, price-level–based understanding of market participation and to make more informed trading decisions.
How To Install
-
IMPORT
in ninjatrader 8 go to Tools - Import - NinjaScript Add-on and select the indicator zip folder
-
Enable Tick Replay
in ninjatrader 8 go to Tools - Settings - Market Data and check Show Tick Replay
after that on your chart double click on a candle or go to Data Series and check Show tick replay
-
Add To Chart
the indicator is ready, go to Indicators and you will have a LPMDT collection with the indicator inside
Indicators Installation Process
Tick Replay Activation
3rd Party Licensing
