


LPMDT Trading
Cumulative Volume Dtelta (CVD) TRIAL 7Days
Cumulative Volume Dtelta (CVD) TRIAL 7Days
Couldn't load pickup availability
The Cumulative Volume Delta (CVD) indicator plots cumulative buy vs. sell volume as a candlestick series.
What It Indicates
- Directional Conviction : Rising CVD means buyers are consistently more aggressive; falling CVD means sellers are in control.
- Absorption : If price moves down but CVD holds steady (or rises), it suggests buyers are stepping in to absorb selling.
- Divergences : Price making new highs while CVD fails to follow can warn of weakening buying pressure (and vice versa).
- Momentum Confirmation : When CVD trends align with price trends, it reinforces the strength of that move.
Common Use Cases
- Confirming breakouts or breakdowns by checking if volume aggression backs the price move.
- Spotting exhaustion when price extends but CVD flattens or turns.
- Identifying support/resistance logic—strong buying at lows or strong selling at highs.
- Integrating with order-flow tools (footprints, volume profiles) for more granular entry and exit timing.
By focusing on the net flow of aggressive orders rather than total volume, CVD gives traders a direct read on which side—buyers or sellers—is truly driving the market.
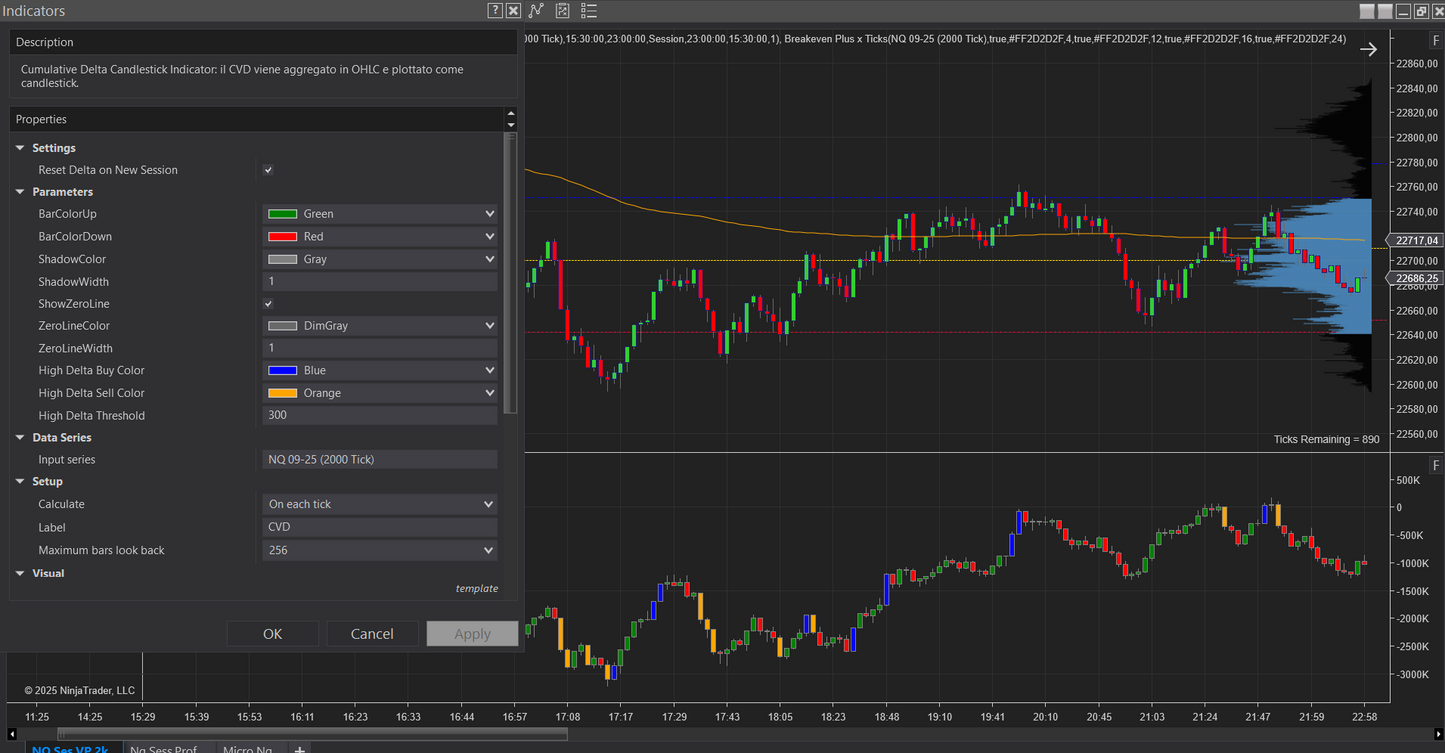
Delta Threshold
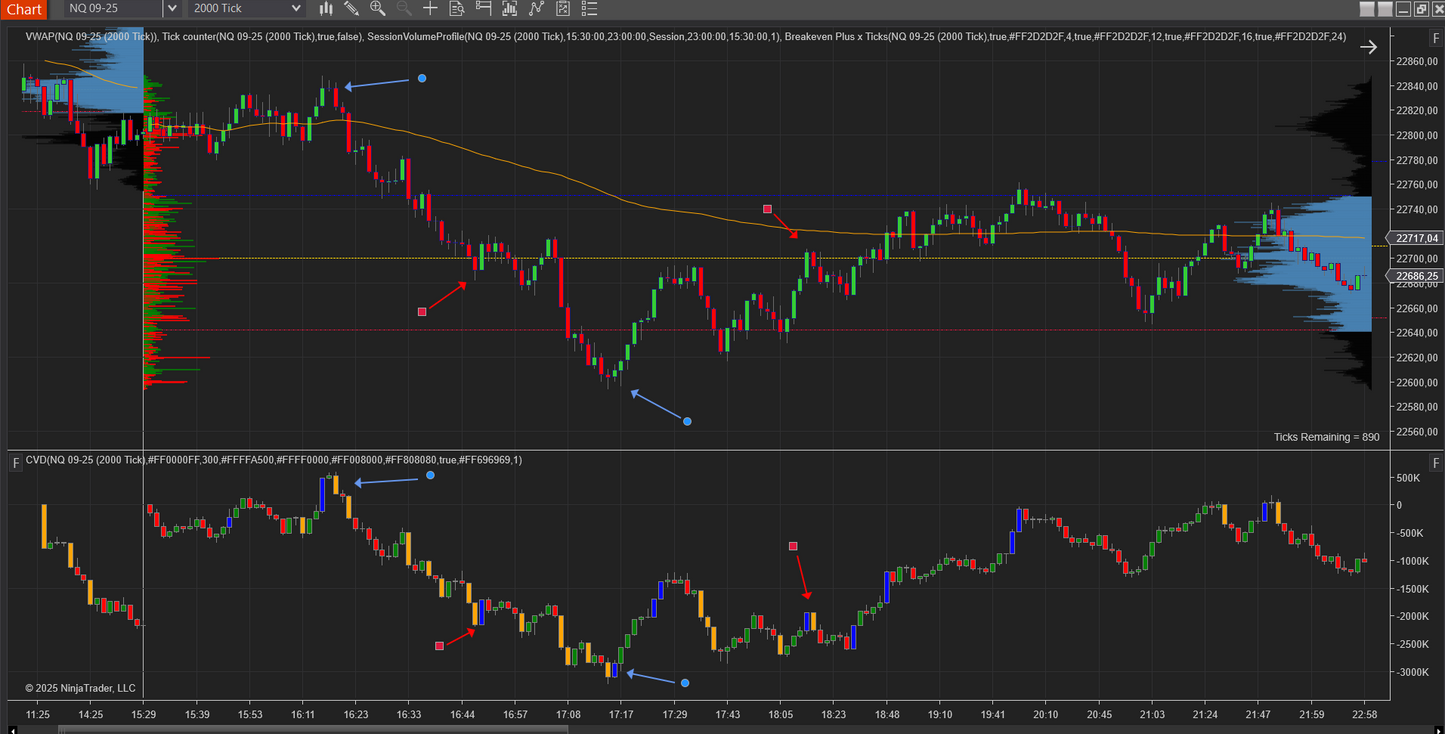
Plus our version highlights any bar whose raw delta exceeds a user-defined threshold—marking strong buying or selling pressure
whenever a bar's raw delta exceeds the user-defined threshold, that bar is flagged What's interesting is that these threshold signals very often line up with volume imbalances or absorption events in the order-flow

and with this function we can notice some behaviors such as in price reversals we often have a rapid succession of "imbalances" in opposite directions, as indicated by the blue arrows. but there are also false signals where no price reversals occur as indicated by the red arrows, so this function alone does not represent entry signals
How To Install
-
IMPORT
in ninjatrader 8 go to Tools - Import - NinjaScript Add-on and select the indicator zip folder
-
Enable Tick Replay
in ninjatrader 8 go to Tools - Settings - Market Data and check Show Tick Replay
after that on your chart double click on a candle or go to Data Series and check Show tick replay
-
Add To Chart
the indicator is ready, go to Indicators and you will have a LPMDT collection with the indicator inside
Tick Replay Activation
TRIAL Indicators Installation Process
