


LPMDT Trading
Custom Range Volume Profile (TRIAL 7days)
Custom Range Volume Profile (TRIAL 7days)
Couldn't load pickup availability
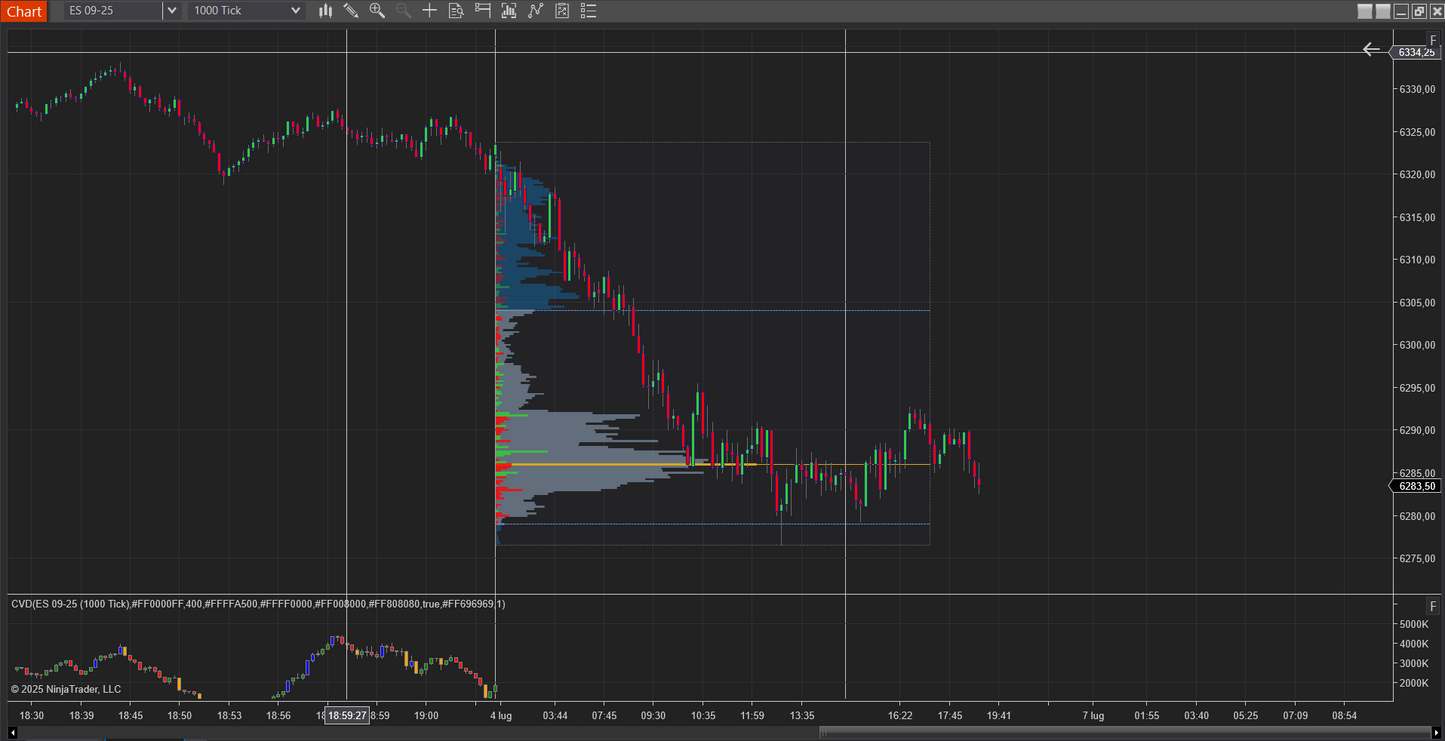
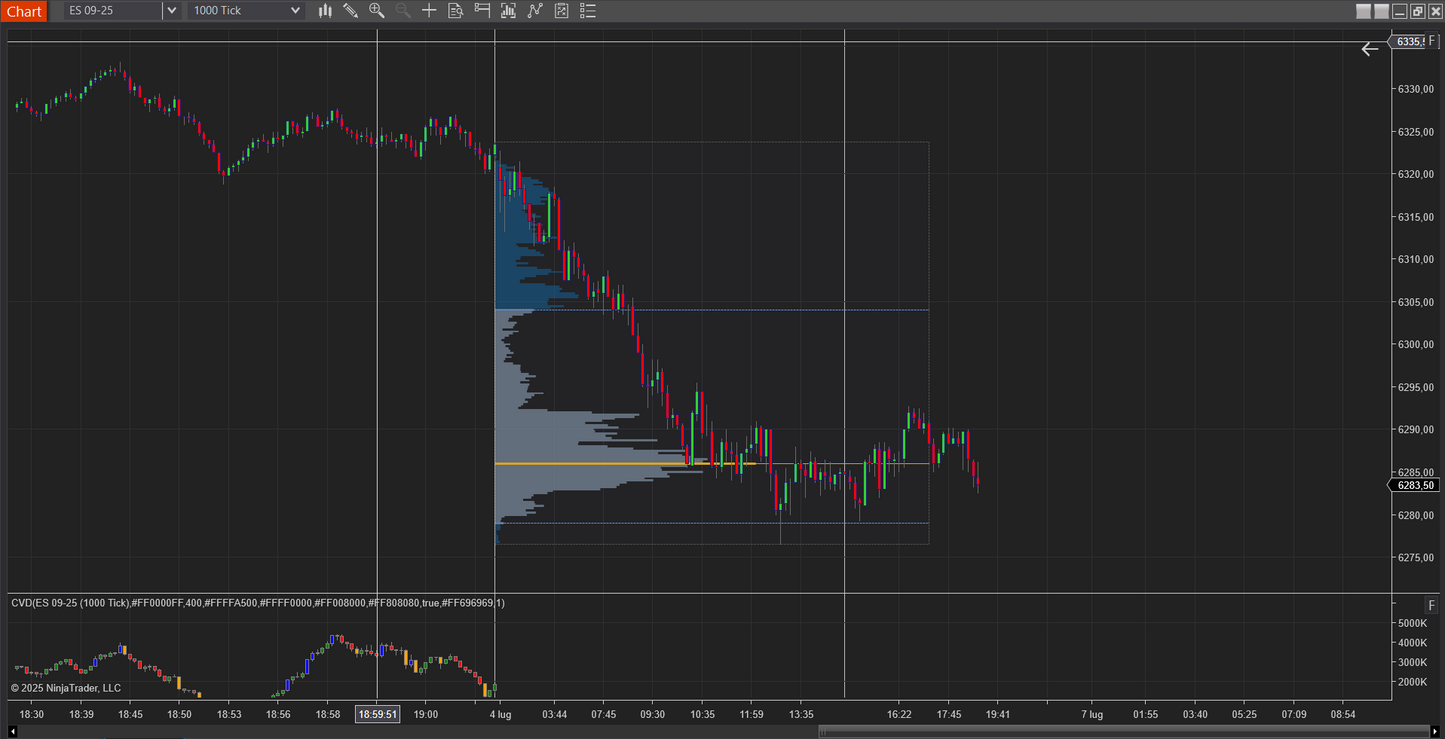
The Custom Range Volume Profile Drawing Tool lets you define any start/end anchors on your chart and instantly plots a horizontal volume histogram over that range. It also offers an optional Delta Profile mode, showing net buy vs. sell volume at each price level.
Key Features
-
Flexible Range Selection
Draw dynamic start and end anchors with your mouse to recalibrate the profile on the fly. -
Total Volume Profile
Displays traded volume at each price as a horizontal bar chart beside the price axis. -
Delta Profile Mode
Instead of total volume, paints net volume (buys minus sells) per price level using separate up/down colors. -
Value Area & POC
Automatically computes and draws: - Value Area High/Low (VAH/VAL) : the upper/lower bounds containing a configurable percentage (default 70%) of total volume.
- Point of Control (POC) : the single price level with the highest volume.
-
Customizable Styling
Choose fill colors, opacities, bar widths, and line strokes for Volume, Delta, Value Area, and POC.ù
A Volume Profile visualizes where market participants traded most heavily, plotting cumulative volume at each discrete price level rather than over time. Key components include:
- Histogram Bars : Longer bars mark price levels with more volume.
- Value Area : The price band encompassing the majority (eg, 70%) of volume—seen as the market's fair-value range.
- POC : The price with the single largest volume—often acting as a magnet or pivot.
- High/Low Volume Nodes : Peaks and valleys in the histogram that can form support/resistance zones or trigger fast moves.
Common Uses
-
Support & Resistance Identification
High-volume nodes tend to hold price, while low-volume areas allow swift breakouts. -
Trend Confirmation
A breakout above a high-volume area on strong volume suggests genuine conviction. -
Entry & Exit Timing
Fade moves at the edges of the Value Area, or target extensions beyond the profile's boundaries. -
Delta Insights
In Delta Profile mode, spots where aggressive buying or selling dominates at specific price levels. -
Contextual Analysis
Combine with price action, order-flow footprints, or moving averages to validate trade setups.
Use this tool to gain a deeper, price-level–based understanding of market participation and to make more informed trading decisions.
How To Install
-
EXPORT
(Below you will find the video of the entire process). After the download you will have a zip folder, extract the contents, inside you will have the license file, the template to split the rth and eth sessions and another zip folder that you do not have to extract with the indicator
-
IMPORT
in ninjatrader 8 go to Tools - Import - NinjaScript Add-on and select the indicator zip folder
-
IMPORT LICENSE
Paste the "License" file into your ninjatrader8 folder: C/ User/ User name/ Documents/ Ninjatrader8 or usually all PCs have a shortcut to access Documents in that case Documents/ Ninjatrader8 and just paste your file here
PS Do not modify the file in any way or the indicator will not work
-
Import Trading Hour Template
Paste the "CME US Index....xml" file into your ninjatrader8 templates folder: C/ User/ User name\Documents\NinjaTrader 8\templates\TradingHours paste your file here
-
Add To Chart
the indicator is ready you just need to enable Tick Replay and go to Indicators and you will have a LPMDT collection with the indicator inside