


LPMDT Trading
Delta Profile Bars
Delta Profile Bars
Couldn't load pickup availability
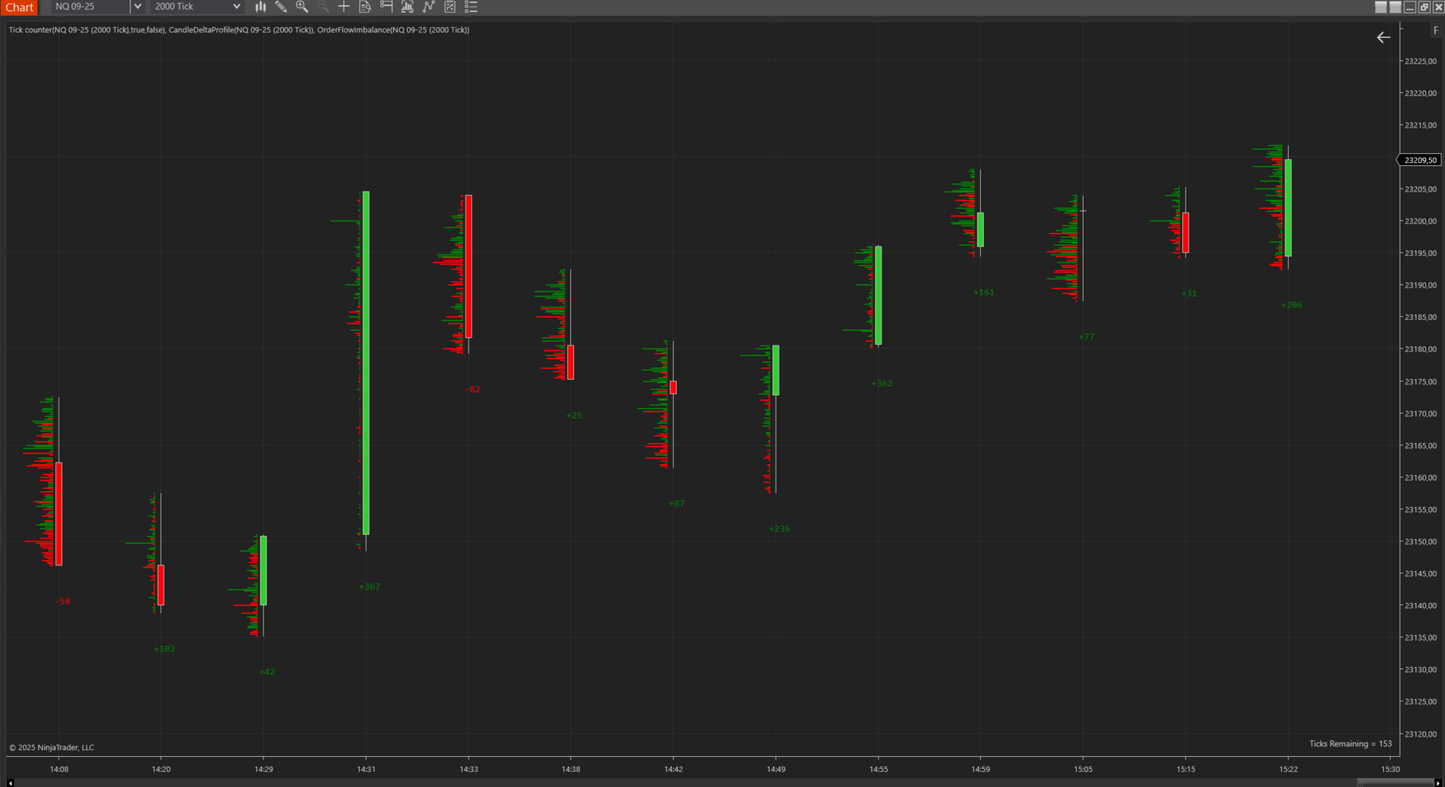
The Delta Profile Bars indicator calculates and plots the delta profile of each individual candle directly beside it, allowing traders to visually interpret the distribution of aggressive buyers vs. sellers across price levels. In addition, it displays the total delta value below each candle, offering clear insight into the net buying or selling pressure within that bar.
- 📊 Delta Profile Visualization:
Each candle is accompanied by a horizontal bar plot showing buy vs. sell market order imbalance at each price level. - 📉 Total Delta Display:
A numerical value of total delta appears beneath each candle, quantifying the net difference between market buys and sells.
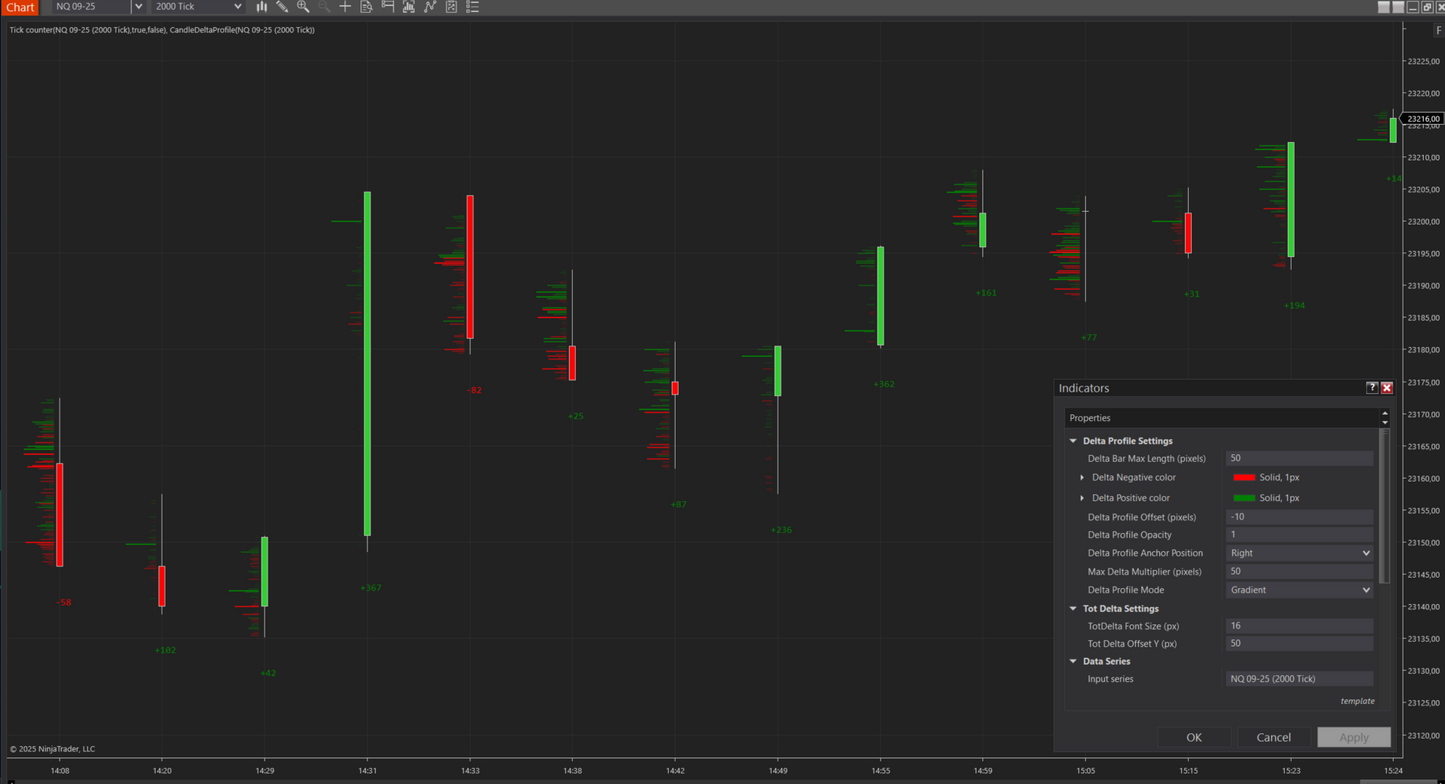
Visualization Options: Standard & Gradient Modes
The Delta Profile Bars indicator offers two distinct display modes: Standard and Gradient .
- In Standard mode , each level of the delta profile is plotted uniformly, giving you a clear and consistent view of buy/sell imbalances at every price.
- In Gradient mode , intensity coloring is applied—allowing peak delta levels to stand out visually with stronger hues, so you can instantly spot zones of extreme market pressure or absorption.
These visualization options give traders flexibility in how they read the data, adapting to different styles of analysis and helping surface the most influential price levels with greater clarity.
🎯 Practical Uses of Delta Profile
The Delta Profile is a powerful tool for reading market sentiment and short-term momentum. Traders may use it for:
-
Spotting Absorption or Aggression:
Detect when strong buying gets absorbed by passive sellers (or vice versa), which may signal reversals. -
Confirming Breakouts:
High positive delta during a breakout candle may confirm buyer commitment; low or negative delta might suggest a fake-out. -
Identifying Trapped Traders:
A candle showing strong delta opposite to the price direction may hint at trapped buyers/sellers. -
Refining Entries and Exits:
Combine delta signals with volume or price action to time entries with better precision. -
Building Short-Term Bias:
Consistent delta behavior over several bars can help establish short-term bullish or bearish bias.
How To Install
-
IMPORT
in ninjatrader 8 go to Tools - Import - NinjaScript Add-on and select the indicator zip folder
-
Enable Tick Replay
in ninjatrader 8 go to Tools - Settings - Market Data and check Show Tick Replay
after that on your chart double click on a candle or go to Data Series and check Show tick replay
-
Add To Chart
the indicator is ready, go to Indicators and you will have a LPMDT collection with the indicator inside
Indicators Installation Process
Tick Replay Activation
3rd Party Licensing
